Building Custom Dashboard Widgets in SQL Operations Studio

Visual Studio is dead. Long live Visual Studio!
Hey, did you see the new hotness? SQL Operations Studio just hit public preview, which means mere mortals like you and I can download and explore it. If I was thrilled when VS Code came along and freed me from the bloat of Visual Studio, I’m just as thrilled (if not more so) of the promise of what SQL Operations Studio can do to free me from SQL Server Management Studio (SSMS) and get me out of having to have a Visual Studio Shell to make it work. It’s not that I dislike SSMS, it’s just that it has become a little too big (Seriously? A nearly-gigabyte download, for that?) and slow for my tastes. I like fast, snappy apps and so far I’m liking SQL Operations Studio.
Since this is built on top of the Visual Studio Code shell, that means it inherits a lot of the goodness of what makes that program pretty great. Which is to say, it’s easy to customize. This is a good thing, because if you open the program and connect to a server, you’ll see this:
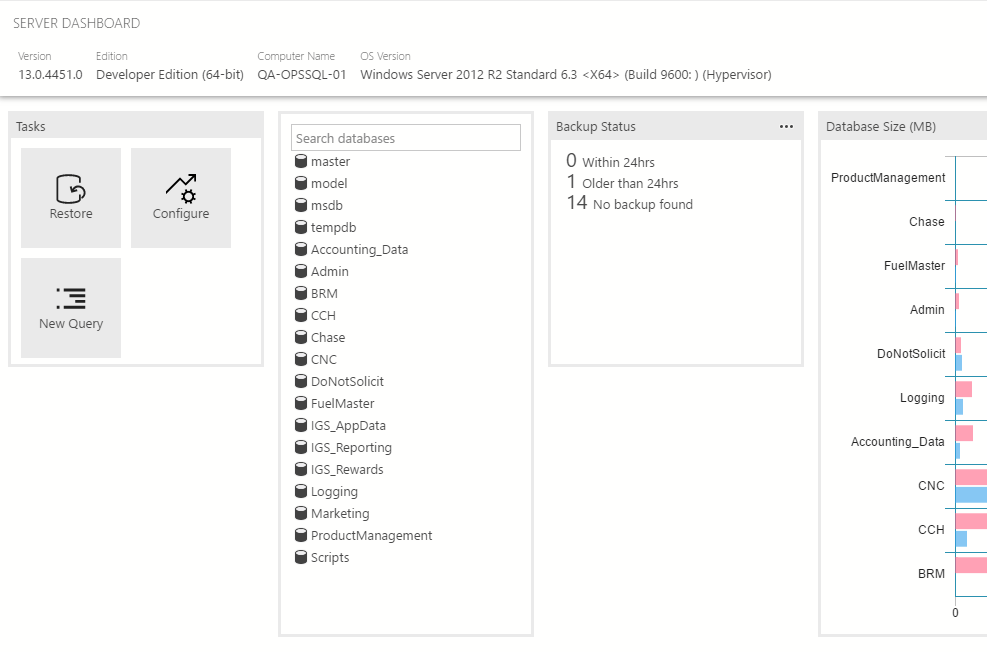 One word jumped out at me right away: dashboard. I like the out-of-the-box widgets that are featured in the application, but what if you want deeper insights? Since this is a preview, I can only assume more widgets will come with the finished product. But if you don’t want to wait, there’s no reason you can’t roll your own. So let’s do that!
When I think of SQL Server dashboards, I can’t help but think of wanting to see wait statistics for my servers. If we wanted to create a wait statistics widget, here’s what we need to do, in a nutshell:
- Create a query that will drive the widget. In this case, we’re going to go with the best: Paul Randal’s Wait Stats query. We’ll use this to get our data.
- Once we have the query results how we want, we’ll create an insight in SQL Operations Studio.
- We’ll take the output of our insight and apply it to our user settings.
Let’s do it.
Show me what you got
If you haven’t already, you’ll want to download SQL Operations Studio. Once it’s installed, fire it up. Go ahead and connect to a SQL Server. Once you do, then use Control+N to create a new query (or use the mouse and click File -> New Query. Like an animal).
In the new query window, paste Paul’s query. Go ahead and execute it. Weep at your long wait times. I’ll be here when you’re done.
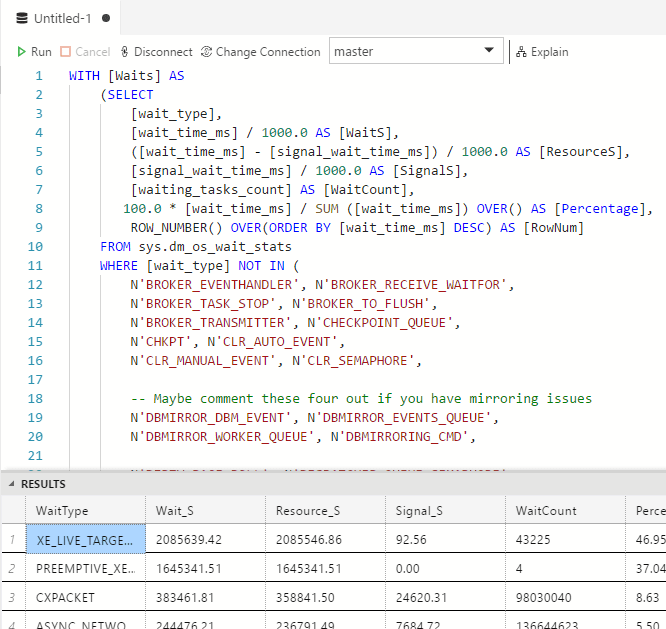
All better? Cool. Now, save your query. You’ll want to save this some place that won’t accidentally delete it (more on that in a moment). Next, you’ll want to click on the “View as chart” button. It can be small and hard to find, but it’s there, on the right side of your results screen. This will give you an idea of what your query will look like as a widget (click on the picture for a larger version).
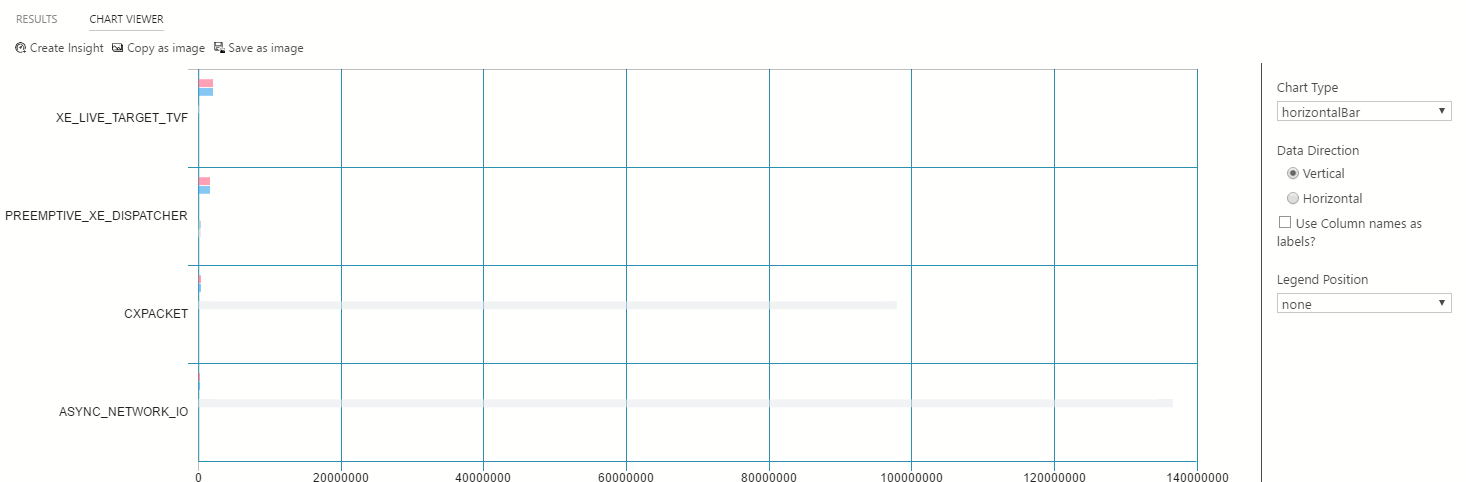 You can also adjust the output here, too. You can change orientation, add a legend, or even turn it into a pie chart (if you want to make Johnathan Stewart cry).
When you’re satisfied, we now need to get your chart’s insight code. To do that, click on the “create insight” button at the top of the chart. You’ll get some code that looks like this:
{
    "name": "Server Wait Statistics",
    "gridItemConfig": {
        "sizex": 5,
        "sizey": 2
    },
    "widget": {
        "insights-widget": {
            "type": {
                "horizontalBar": {
                    "dataDirection": "vertical",
                    "dataType": "number",
                    "legendPosition": "none",
                    "labelFirstColumn": false,
                    "columnsAsLabels": false
                }
            },
            "queryFile": "c:\\temp\\waitstatsquery.sql"
        }
    }
}
Before we go on, now’s your chance to name your widget. In my code above, I highlighted some of the changes I made. Also notice that this widget has a path to the query file we created; if this file doesn’t exist (or you can’t read from the path it exists on), it’ll stop working. Just a heads-up.
I named it something meaningful (but hey, do you), and I changed the vertical and horizontal size of the widget to be a little easier to read. Once you’re done, it’s time to add your widget to the dashboard.
Just like VS Code, each user has a settings.json file that stores values that either compliments or overrides application settings. To add the widget to your dashboard, we need to put the insight code into your settings file. To do that in SQL Opeartions Studio, hit Control+Comma (,) to open the settings panel. You’ll get a split screen:

You can’t edit the program settings on the left directly. Instead, you can copy and paste settings you want to modify in your settings.json file and then tweak what you want. Which is how we’re going to add our widget.
At the top of the screen in the “Search Settings” bar, type in dashboard. The window on the left should change to reflect matches in the default settings window (the left side). We’re looking for the section that says: “Customizes the server dashboard page.” You’ll want to copy and paste that entire section into your file on the right (obeying proper JSON notation as you do).
Here’s what my settings file looks like, after adding in the widget code:
{
    "datasource.connectionGroups": [
        {
            "name": "ROOT",
            "id": "C777F06B-202E-4480-B475-FA416154D458"
        }
    ],
    "datasource.connections": [
        {
            "options": {
                "server": "qa-chsql",
                "database": "",
                "authenticationType": "Integrated",
                "user": "",
                "password": "",
                "applicationName": "sqlops",
                "groupId": "C777F06B-202E-4480-B475-FA416154D458",
                "databaseDisplayName": ""
            },
            "groupId": "C777F06B-202E-4480-B475-FA416154D458",
            "providerName": "MSSQL",
            "savePassword": true,
            "id": "5211205f-444a-48ea-a3b4-88888692c615"
        }
    ],
    "dashboard.server.widgets": [
        {
          "name": "Tasks",
          "widget": {
            "tasks-widget": {}
          },
          "gridItemConfig": {
            "sizex": 1,
            "sizey": 1
          }
        },
        {
          "gridItemConfig": {
            "sizex": 1,
            "sizey": 2
          },
          "widget": {
            "explorer-widget": {}
          }
        },
        {
          "widget": {
            "backup-history-server-insight": {
              "cacheId": "0c7cba8b-c87a-4bcc-ae54-2f40a5503a90"
            }
          }
        },
        {
          "widget": {
            "all-database-size-server-insight": {
              "cacheId": "1d7cba8b-c87a-4bcc-ae54-2f40a5503a90"
            }
          }
        },
        {
            "name": "Server Wait Statistics",
            "gridItemConfig": {
                "sizex": 5,
                "sizey": 2
            },
            "widget": {
                "insights-widget": {
                    "type": {
                        "horizontalBar": {
                            "dataDirection": "vertical",
                            "dataType": "number",
                            "legendPosition": "none",
                            "labelFirstColumn": false,
                            "columnsAsLabels": true
                        }
                    },
                    "queryFile": "c:\\temp\\waitstatsquery.sql"
                }
            }
        }
      ]
}
Notice that I not only copied over the dashboard settings, but I added my code as part of the JSON file (and added a comma). I highlighted my changes to make it a little easier to read.
Once this is done, save your user settings file. Now, the next time you open a server, you should see your wait statistics chart, like so:
 Pretty cool, huh?
Use your imagination
Of course, this is just a quick and dirty example. But think of all the possibilities this kind of customization can add to your daily life! If you can write a query for it, you can make it part of your server dashboards. I’m really excited to see what new functionality and customization get added to the product in future releases.
I can’t say I’m totally on board yet and moving away from SSMS, but this shows incredible promise. What do you think? Give it a download if you haven’t, and feel free to share your best customizations so far.
Any toughts on how you can import registered svrs from ssms?
Not yet, but maybe I can put something together for tomorrow!
Hi Hiram, good news… you should check out my new post today: https://wp.me/p5CLJc-sJ I think you’ll be pleased 🙂
Pingback: Custom SQL Operations Studio Dashboard Widgets – Curated SQL
Pingback: Importing Registered Servers from SSMS into SQL Operations Studio – Port 1433